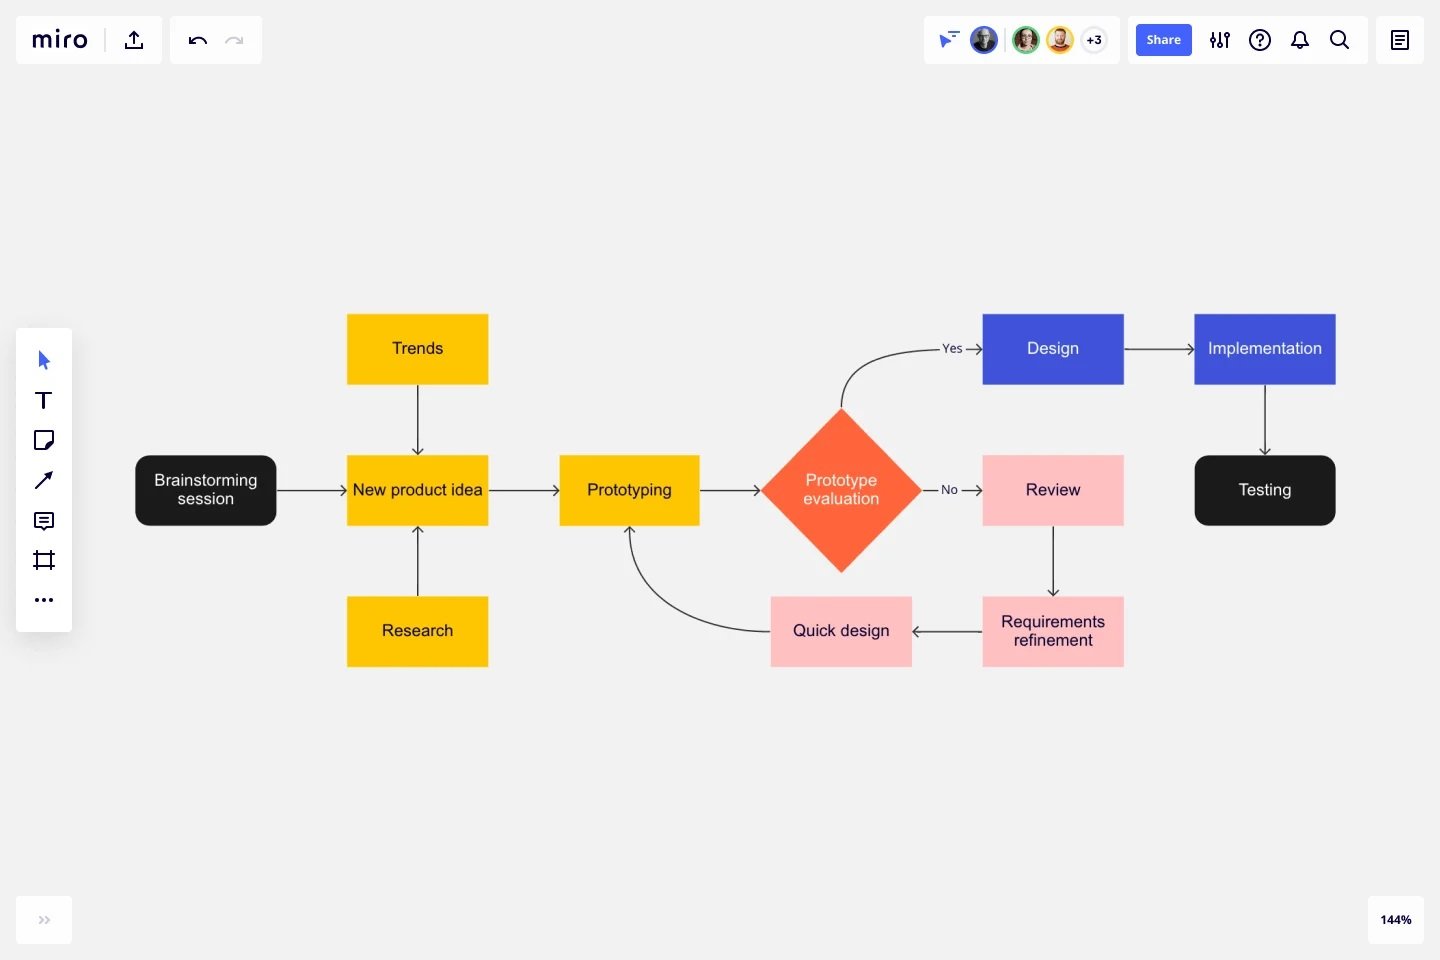
Flowchart Template
Develop a step-by-step visual guide to different processes.
About the Flowchart template
What is a flowchart?
A flowchart is a graphical or symbolic representation of a given process. You use symbols to depict each step of the process. Many flowcharts contain brief descriptions of each step. Most people use arrows to link various steps together and to indicate the direction of process flow.
There are a few commonly accepted flowchart shapes. For example, ovals generally represent the beginning or end of a process, rectangles represent a process, diamonds represent a decision, and arrows indicate the order in which steps should occur.
When to use flowcharts
When you’re trying to wrap your head around a process, it can be useful to have a visual representation of each step. Your team can create flowcharts for new projects, or to refine and improve how existing processes work.
Here are 4 types of charts:
Process flowchart: The process flowchart is probably the most commonly used example. Just as the name implies, it depicts a process step-by-step. Your team can use a process flowchart to map out roles and responsibilities within an organization, draw up a proposal for a process, or illustrate a complex workflow.
Workflow chart: The workflow chart helps you understand how your business functions—specifically, how data and documents flow throughout your organization. You can use workflow charts to bring new employees up to speed, discover bottlenecks and inefficiencies, and clarify business operations.
Swimlane flowchart: The swimlane flowchart depicts multiple flows of information side by side. Most people use these types of flowcharts to illustrate processes that intersect or interact with different parts of an organization, or to illustrate collaborative processes.
Data flowchart: Data flowcharts are designed to show how data is processed. There are a variety of applications: engineers use data flowcharts to design or analyze systems, while marketers use data flowcharts to understand consumer behavior.
Benefits of using a flowchart
By creating a visual representation of your business processes, your team can quickly see how various process components relate to one another. Flowcharts also can reveal process flaws and bottlenecks, which ultimately helps your team solve problems and improve your products.
Create your own flowchart
Start by selecting Miro’s fully customizable, premade Flowchart template. This simple whiteboard tool allows you to invite teammates to join the board and collaborate. Here’s how to get started:
Decide on the process your team wants to document or illustrate.
List the steps to complete in order to execute the process.
Designate symbols for the various steps in the process.
Draw your symbols and label them according to the steps they represent.
Draw arrows to link the steps.
Review your flowchart with stakeholders and iterate as necessary.
You can use sticky notes or icons to make your flowchart clearer and more visually engaging. If you need input from a team member, you can @mention them or start a video chat.
Related Templates
-

Screen Flow
-

Project Charter
-

Workflow
-

Meeting Organizer
-

Impact Mapping
-

Work Breakdown Structure

